Like most successful organizations, Klaytn Foundation firmly believes in data-driven decision making. In this article, we’ll be sharing some of the on-chain metrics and insights gleaned by our data researchers based on data from the month of April 2023.
The data sources in this article are drawn from GCP BigQuery, Flipside Crypto, and Crypto Quant.
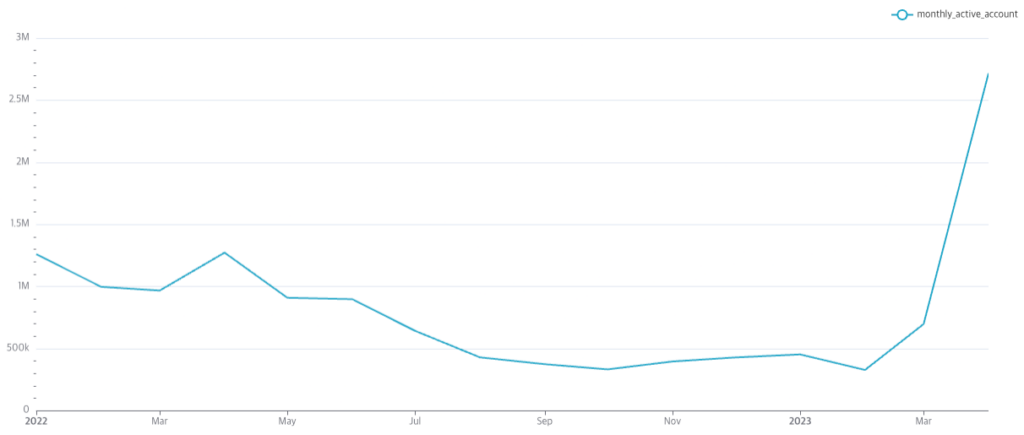
Monthly Active Accounts (MAA)
Monthly Active Accounts (MAA) is a metric that shows the number of accounts that have made at least one transaction in a month. It is the most direct indicator of how many users are participating in the ecosystem, and how active the ecosystem is.
Klaytn’s MAA for April was 27.2K, a 289% increase from March and a whopping 726% increase from February.
Among the major EVM chains, Klaytn showed the largest gains, with Avalanche being the only other chain showing significant gains of 84.4%. Ethereum and BSC are down 9.7% and 18.3% month-over-month, respectively, while Polygon is up 2.3%.
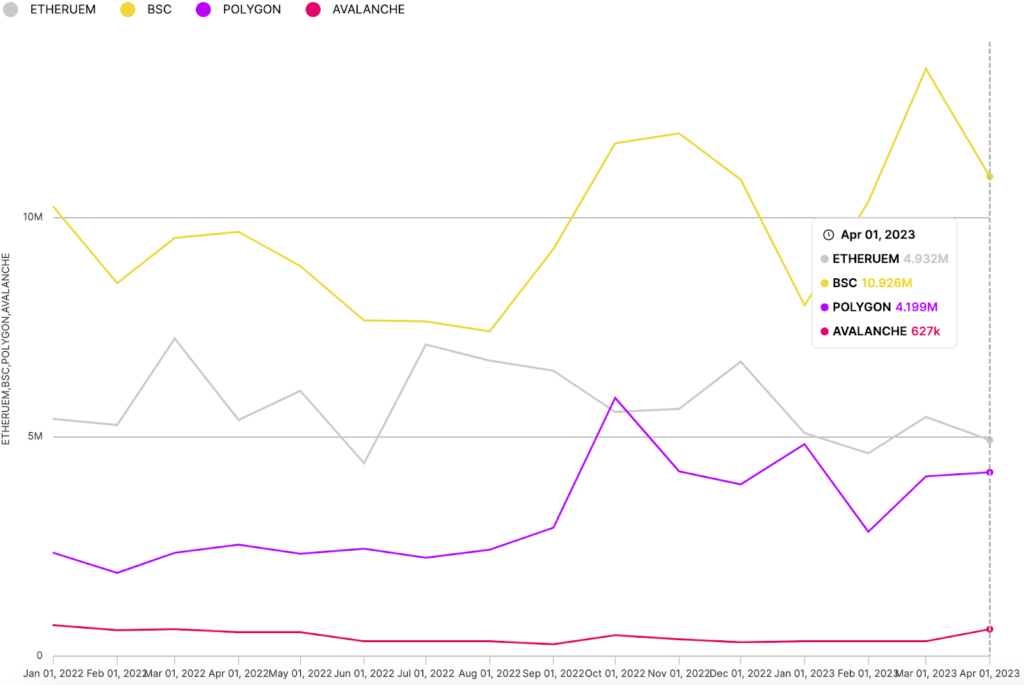
This large increase in Klaytn’s MAA was driven by Iskra. About 2.48m accounts interacted with Iskra in the last month, accounting for 90% of April’s MAA. An interesting point to note is that despite the large number of users Iskra acquired, it did not actually spend a lot in gas fees. The contract that spent the most gas fees last month was DeFi Kingdoms, with around 99,000 $KLAY spent on gas fees, followed by Iskra with 29,900 $KLAY spent. Even though 63% of all Iskra users have only interacted with Iskra once, the overall growth in recurring users is still significant.
On Avalanche, contracts like USDC, Trader Joe’s, BTC.b, Stargate, and LayerZero are driving significant user growth.
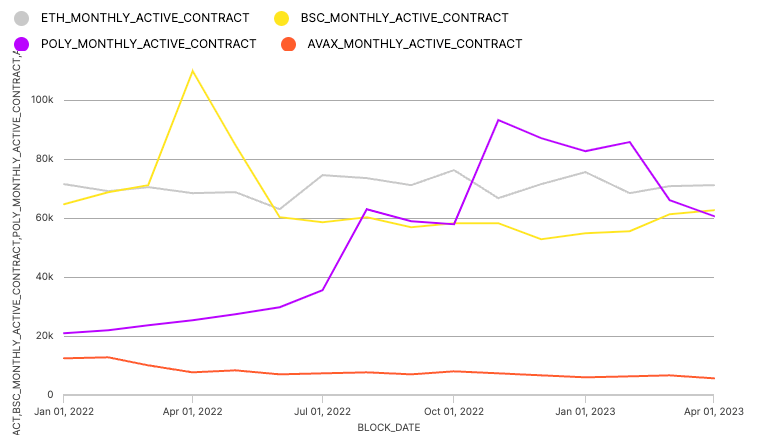
Monthly Active Contracts (MAC)
Monthly Active Contracts (MAC) shows the number of contracts that have been invoked at least once in a month. It is an indicator of how active projects in the ecosystem are and how active developers are.
Klaytn’s MAC for April was 9,403, an increase of 8% from March and 26% from February.
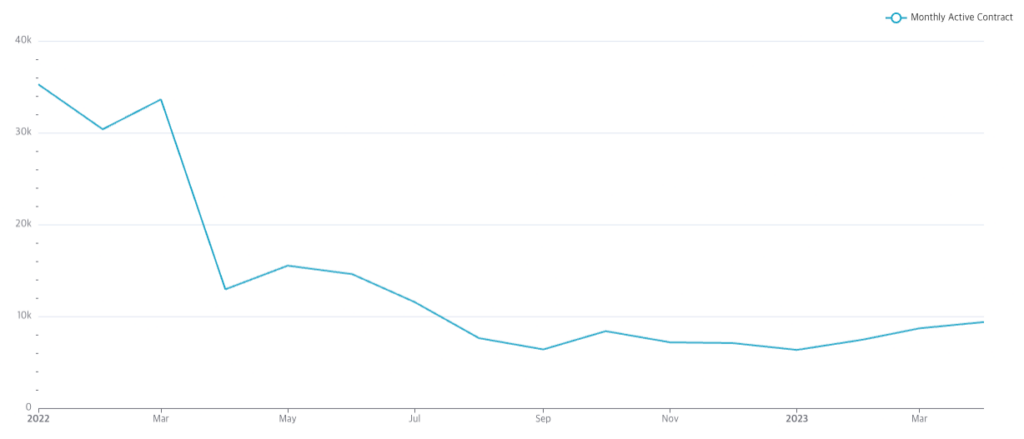
The major EVM chains either saw no significant change in their numbers or saw a downward trend. Ethereum and BSC remained flat at around 0%, while Polygon and Avalanche dropped 8.7% and 16.5% respectively. Klaytn was the only major EVM chain to show an upward trend in MAC. Among Klaytn’s recent MAC, we found that 5,018 and 6,258 contracts were deployed in March and April respectively, a clear indicator of growth in developer activity.
Overall, Klaytn’s MAA and MAC numbers for April show healthy growth in both ecosystem services and builder activity, which indicate that the fundamentals of the Klaytn ecosystem are improving.
We hope these metrics have given you an insight into the state of the Klaytn ecosystem. Moving forward, we’ll continue to share metrics on a more frequent basis to shed more light on the health and growth of the Klaytn ecosystem.