TL;DR:
- Network latency greatly determines user experience for the metaverse
- We compared the latency for different blockchains
- Klaytn showed the lowest average latency, making it the most suitable blockchain for the metaverse
It is a well-established fact in the Web2 world that latency can make or break a service. Users don’t like to wait and will leave a service the moment they experience delays, with almost 4 out of 5 likely to never return. The same holds true for Web3 and the metaverse—in fact, one might argue time-to-finality is even more critical for the metaverse as real-time, instantaneous interactions are a necessity for an immersive user experience.
While Transactions-Per-Second (TPS) may be the poster child for measuring the performance of a blockchain, it is only one half of the equation. Similar to how internet connections need both high bandwidth and low latency to deliver speedy services, blockchain platforms need both high throughput and low transaction latency to do the same.
Take for example, Bitcoin. While it is said to have 7 TPS, the minimum time it takes for a transaction to be executed is 10 minutes, as one block is created every 10 minutes on Bitcoin. What this means is that even if you were the only person executing a transaction on the Bitcoin network (obviously unlikely, but just for demonstration’s sake), it will still take 10 minutes for your transaction to be recorded on the chain. Similarly, Ethereum sits at approximately 20 TPS, but its latency is approximately 12 seconds. Imagine trying to create immersive experiences with 12,000ms ping!

Since TPS has been dominating the performance conversation, we thought it was time to shine some light on network latency—one of the Klaytn’s top priorities as a metaverse-centric blockchain.
We did the testing so you don’t have to
Since network latency is not often publicized, and even then the publicly-stated numbers may be based off theoretical maximums or laboratory testing conditions, we decided to test the real-world network latency of some leading blockchains by submitting transactions to their mainnets and measuring the time it took for our submitted transactions to be included in a block.
Selecting our test candidates
Our test candidates were made up of Klaytn and 10 other chains—eight of which were chosen from the top 50 on CoinMarketCap (as on 01 May 2022), with the addition of Harmony for its claims of being quick and affordable, and Hedera for its quick finality even though it does not have the concept of block generation time.
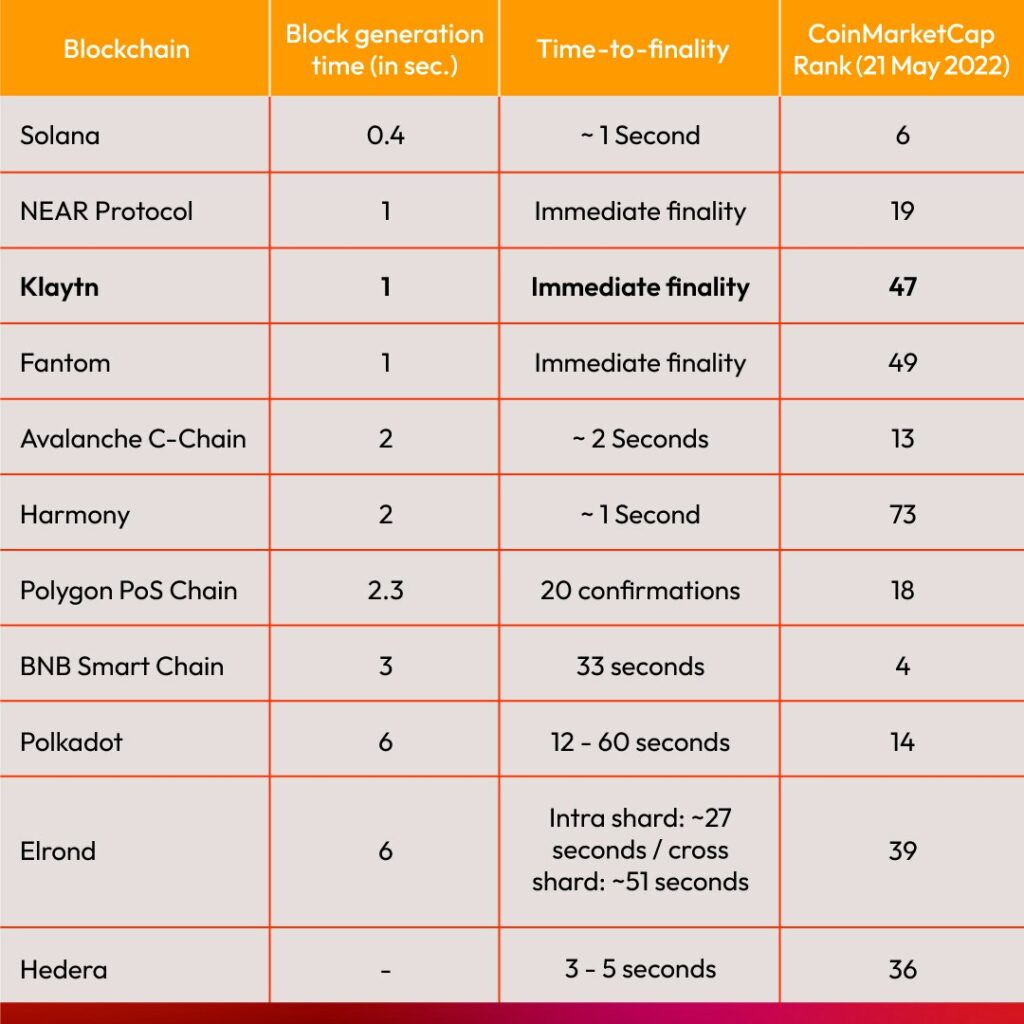
The above table shows the block generation time, time-to-finality, and the CoinMarketCap rank for each chain. Time-to-finality refers to the time it takes for a block to be finalized after a transaction is included in it. The data regarding the block generation and time-to-finality were collected from the official documentation for each chain. In the absence of documentation, we referred to the analytics of their respective explorers as well as publicly-available articles. You can find the list in the References section at the end of this article.
In this experiment, we defined transaction latency as the time it takes for a transaction submitted to the blockchain network to be included in a block. This was measured by creating and signing value transfer transactions using the JavaScript SDKs of each network.
Transaction latency = The time that a transaction was included in a block – The time that the transaction was submitted to the network
We also took into account other factors that can impact transaction latency, such as network congestion and network delays. To obtain data on the network congestion, we collected the gas use for the latest block and the number of transactions. Since the delay will differ for each API endpoint, we settled on a simple request like GetLatestBlockNumber() and measured the ping time, which we defined as the time between the request and the response. Finally, we converted the transaction fees in US dollars using the API provided by CoinGecko for comparison.
Accounting for transaction priority
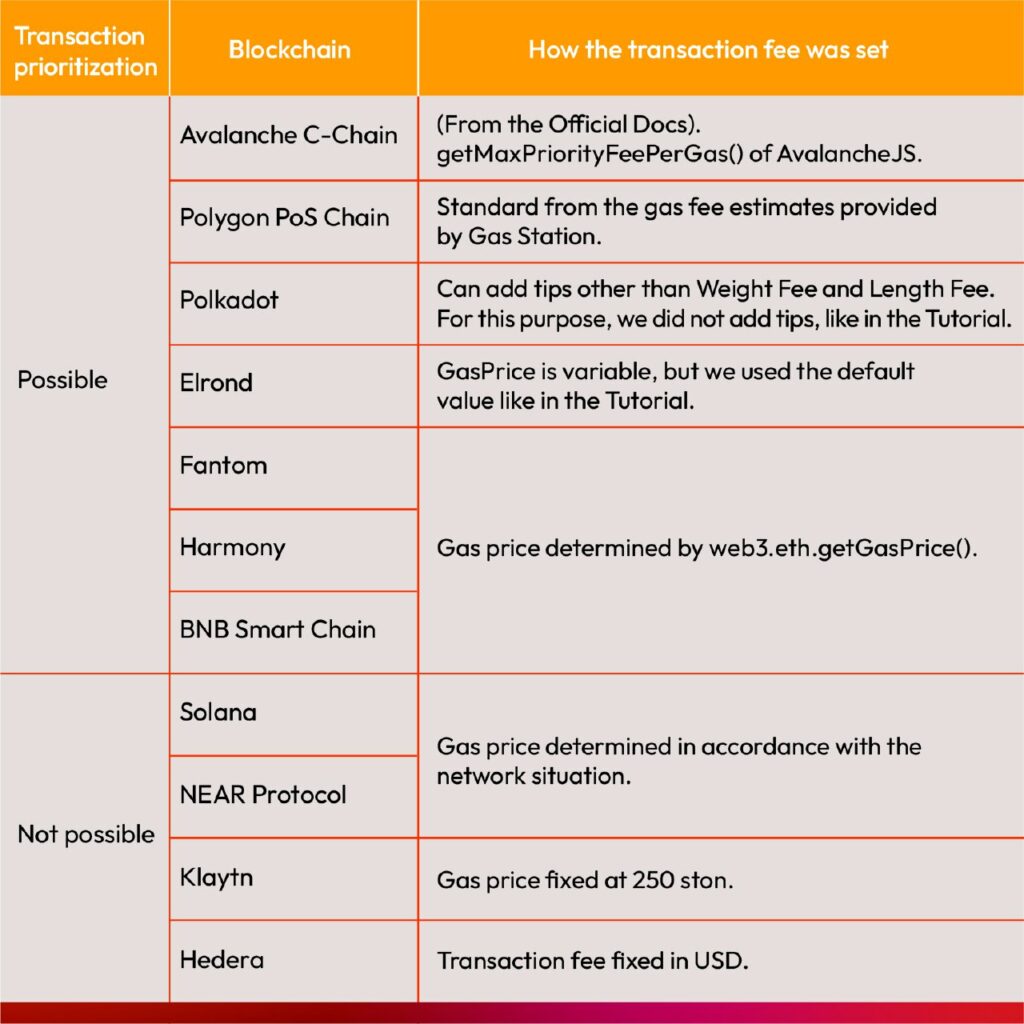
Some of our chosen test candidates include transaction priority features. To account for this, we decided to set the transaction fees based on the code from the transaction tutorials in the official documentation for each blockchain network.
First, the chains with separate priority fees. Polygon PoS Chain and Avalanche C-Chain use EIP-1559, and require that you set maxPriorityFeePerGas and maxFeePerGas for each transaction. For Avalanche C-Chain, we used getMaxPriorityFeePerGas provided by AvalancheJS, following the steps from the official documentation. For Polygon PoS Chain, between the safeLow, standard, and fast values provided by Gas Station, we opted for standard. For Polkadot which allows the adding of tips to give transactions priority, we followed the tutorial and did not add any tips.
Next up are BNB Smart Chain, Harmony, Fantom, and Elrond, which have no priority fees, but allow you to give transactions priority by setting a higher gas fee. The first three of these chains are compatible with the web3.js library, so we set the gas fee using web3.eth.getGasPrice. For Elrond, we used the default values according to erdjs-cookbook.
And last but not least are the networks that either have fixed transaction fees or automatically determine them based on the network traffic. Klaytn currently uses a fixed gas price of 250 ston. Solana and NEAR Protocol have variable transaction fees that are determined according to the network situation, and Hedera has a fixed transaction fee in USD, which is converted to HBAR based on the exchange rate HBAR-USD at the time of submitting the transaction. When you generate transactions on these four platforms, the gas fee is calculated automatically via their SDKs.
The experiment
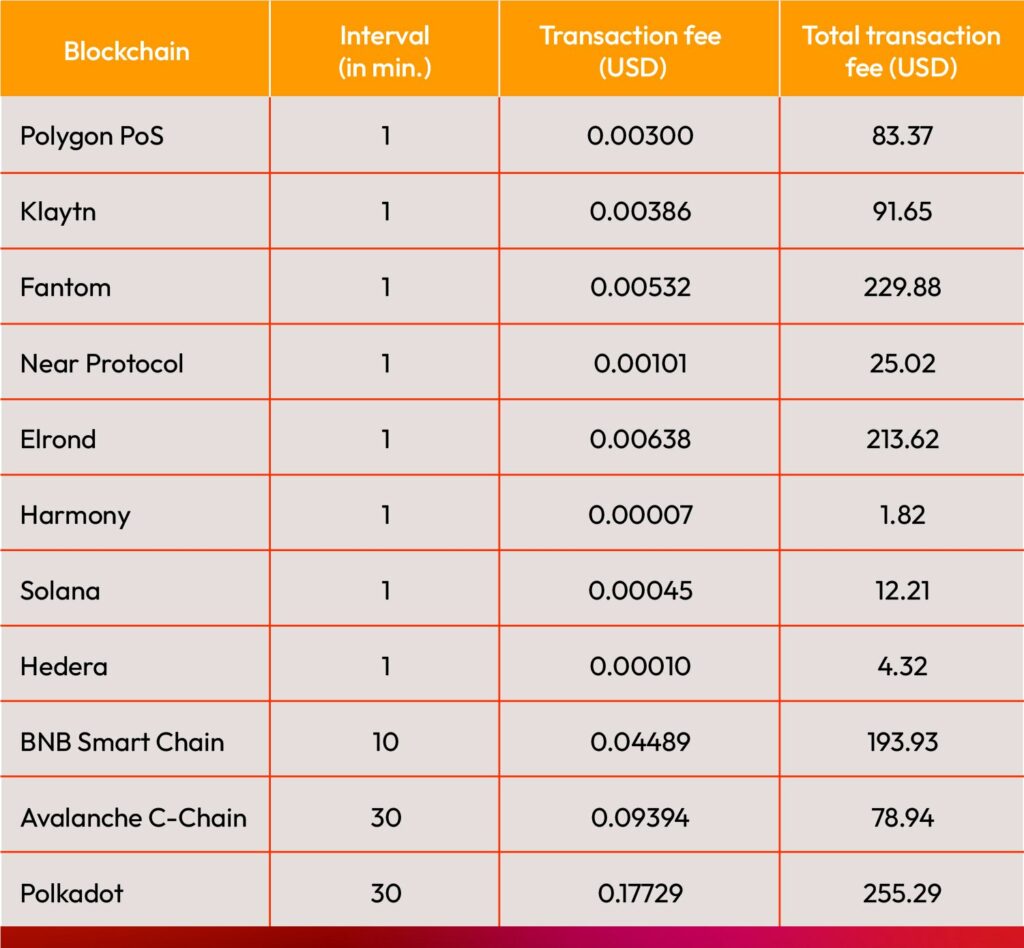
We programmed the experiment to create and submit transactions at fixed intervals such that the total transaction cost for each chain over one month approximates to 200 USD, subject to a maximum rate of one transaction per minute. The transaction fees in the table below are from 17 May 2022.
Most of the candidate chains have transaction fees low enough to reach the maximum cadence of one transaction per minute, except for BNB Smart Chain which was paced at one transaction every 10 minutes, and Avalanche C-Chain and Polkadot once every 30 minutes. If you are interested, the code used for collecting data is available as open source on GitHub.
The results
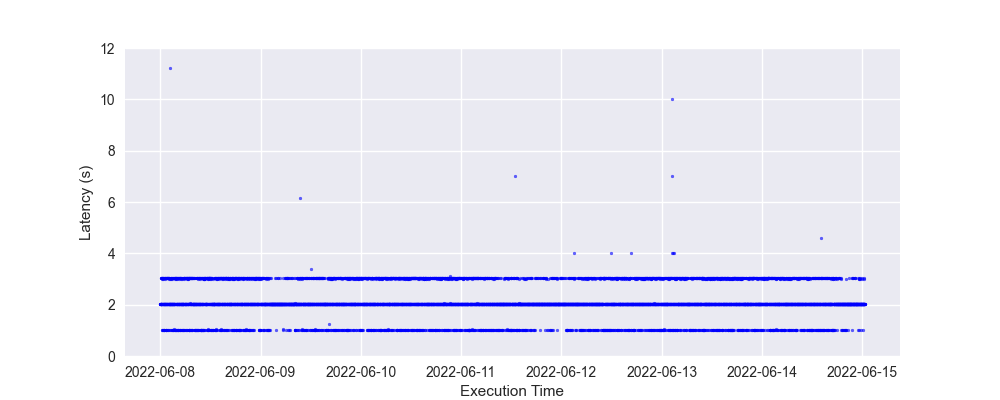
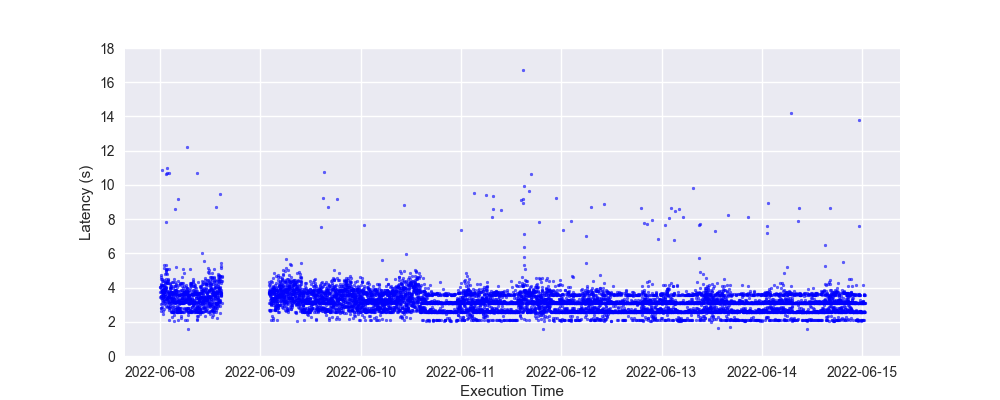
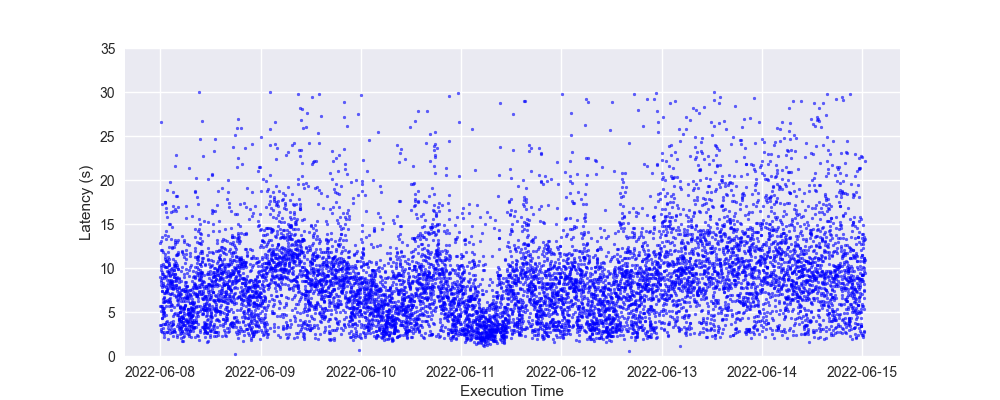
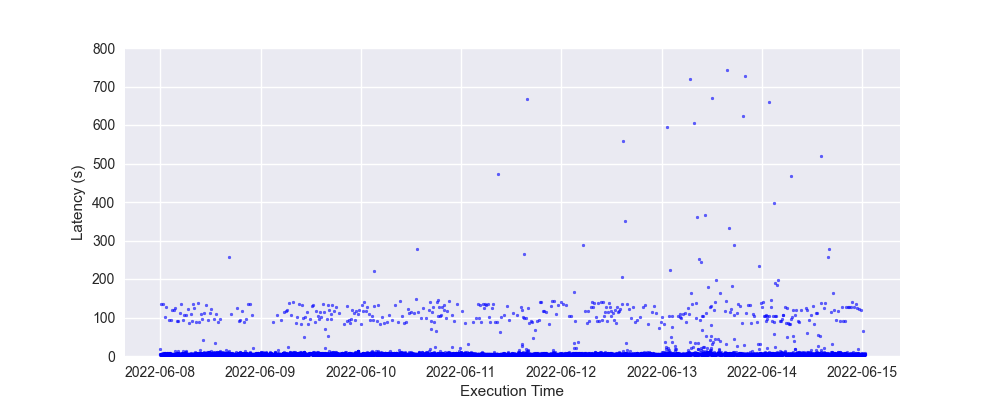
And now, finally on to the juicy bit… the results! The charts below show the results collected between 8 to 15 June 2022. Do note that due to the differences in latency results between each chain, the charts below for each individual chain have different scales for the y-axis.
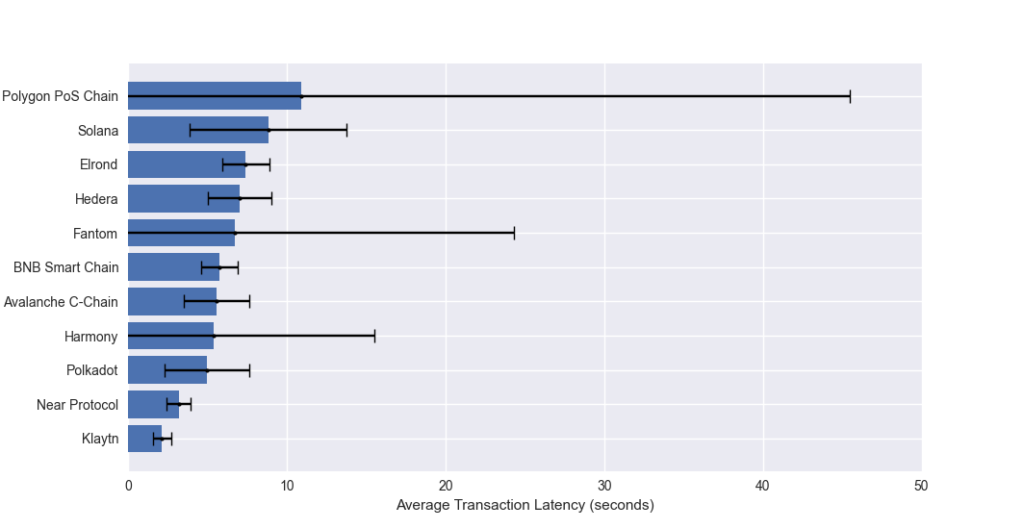
As can be seen from our results, Klaytn had the lowest transaction latency, averaging at 2.1 seconds.
Coming in second is NEAR Protocol, which had an average latency between 2 to 5 seconds, but periodically reaches up to 10 seconds.
On the other end of the results, Solana, the chain that’s all about high TPS, unfortunately also took the crown for highest average transaction latency in our test, with results distributed between 2 to 30 seconds.
Another interesting result came from Polygon PoS Chain, which averaged 10.9 seconds on transaction latency but also regularly exceeded 100 seconds.
The individual charts for the other networks can be found here. The experiment is still ongoing, and the latest results created using data from the week before can be viewed here. There may be gaps in the data collection, which can be ascribed to a number of factors such as errors in the script; outages in the blockchain network, such as with Solana which was not available for data collection for 8 hours on 30 April 2022 and for 4 hours on 1 June 2022; and problems with the RPC endpoints, such as with Hedera where we encountered ‘Error: failed to find a healthy working node’ between 31 May 2022 and 2 June 2022.
If there is a blockchain network that you want analyzed other than the 11 that we’ve included in our experiment, you can either write the code yourself and submit a PR to klaytn/tx-latency-measurement, or leave a comment on our Discord or Klaytn Forum.
Looking beyond transaction latency
There’s another layer to the user experience story—time-to-finality. Despite the common understanding that once data is recorded on a blockchain it is immutable, many popular blockchains utilize probabilistic finality, which means that data stored on those chains have a very tiny chance of being reverted, with the chance decreasing with every subsequent block created after it. For example, Polygon requires 20 confirmations before a block is considered finalized, which can take up to 5 minutes, while Polkadot requires 12 to 60 seconds for transactions to achieve finality. Looking back at the table at the start of this article, we can see that the average transaction takes about 5 seconds to be processed, but around 10 times longer to be finalized.
Similar to transaction latency, the metaverse user experience greatly hinges on quick time-to-finality—if users are going to occasionally have their digital asset transfers reverted a minute after they transacted, they’re going to have a bad time and you’re going to have an empty metaverse.
This is why Klaytn is designed to guarantee immediate finality. Once a block is created on Klaytn, it is immediately finalized and does not require additional confirmation. Between Klaytn having the lowest latency and immediate finality, it is clear that Klaytn is best-specced for the real-time needs of metaverse use cases.
That’s great. Now how about testing real-world TPS?
Of course, TPS remains the other critical half of the equation. However, it can be quite costly to test TPS on mainnets, and there are other external factors that make a ceteris paribus condition difficult to realize, such as having node networks with the same performance, and propagating the same transactions that require equal computing time to the network.
To make this kind of comparison, we would have to set up networks for chains where separate networks are supported and send a large amount of transactions. In addition, it would only make sense to use both FT (Fungible Token) and NFT (Non-Fungible Token) transactions to cater for actual usage scenarios.
It would take quite a bit more time and resources, but we are planning to conduct more experiments, so stay tuned!
References
Code
Test results
Documents related to block generation time
- Klaytn Overview (1-second block generation)
- Blocktime (Solana, Avalanche, Polkadot)
- NEAR Protocol Block Time
- Fantom Average Block Time
- Polygon Average Block Time
- Elrond Blocktime
- BNB Smart Chain Average Block Time
Documents related to Finality
- Solana Whitepaper
- NEAR Protocol Nightshade 3.2 Consensus
- Klaytn: Consensus Mechanism
- Fantom FAQ
- Polygon: Confirmations requirements
- Avalanche Transaction Finality
- Harmony: 2 Seconds Block Finality
- BNB Smart Chain: Security & Finality, BNB Smart Chain: User Experience
- Polkadot: Time to Finality
- Elrond: Transaction Finality
- Hedera: Transaction Confirmation
Documents related to setting up Gas Price
- Polygon: Gas Station Endpoint
- Avalanche: Sending Transactions
- Polkadot: Make a simple transfer
- Elrond erdjs-cookbook
- Solana: Deterministic Transaction Fee
- NEAR Protocol: Gas
- Hedera Fees